12 minutes
Go - Step by step guide for implementing tracing on a microservices architecture (1/2)
Update 2023: The repository with the source code is still having some traction on Github some I decided to update the dependencies as some of them were deprecated and the tracer exporter now uses a different port.
This article is the first of a series of two. In this first one we are going to talk about what is tracing is used for, the scope of this proof of concept and implement the first service.
It works on my machine
Had you ever heard the quote above? I remember once a microservice based system that worked on a stage environment but when tested with real user’s load it was as slow as a turtle.
Sometimes when working with microservices, and when there are lots of them, one can feel inclined to say “let’s do a request to this one” to fetch a field that its needed. But then that microservice is doing a call to two other services, and these two are also doing the same.
When working without heavy load this may work fine, but what if the first microservice receives 100 calls in 5 seconds, how are the rest of the services going to handle the cascade effect?
Documenting a flow is really hard, and I will risk saying that is impossible to maintain. Developers come and go, there is not always someone maintaining the document, and when scaling up and adding a lot of new flows it becomes impossible to keep up to date.
What if there was a way to display on demand an entire user journey? This would allow developers to see effectively which services are involved on it and do refactors, or add new features being conscious about what services are going to be affected. This is also very useful when onboarding new people into the team as they can get the context faster.
Tracing
Tracing is our lord and saviour. It is the action of decorating a log with a trace ID so developers can correlate a user journey all together. Easy right?
This concept does not really depend on any specific tool, one could just do structured logging, add an ID and make sure that it gets propagated on subsequent logs. Then this is queryable on a log aggregator, but it does not help us visualize a flow.
Fortunately, there is a CNCF (Cloud Native Computing Foundation) project named OpenTelemetry that takes care of how the standard looks like, and provides libraries in different languages for people to use.
Using OpenTelemetry one can use tools that allow visualization such as Jaeger, Zipkin or CloudTrace on GCP (it is likely that other cloud providers are also offering their own solution). Also these are stored as metrics instead of logs and this reduces the cost further. For example, in GCP storing 100 million of spans costs 20 USD. That is basically 100 million calls in the system.
Think of the trace as a distributed transaction. Each user journey will have a trace, and the trace will contain 1 to N spans. A span is basically an operation that happened in that trace. It can be an HTTP call, consuming an AMQP message, calling to a database.
A span contains a name, an originating service, and it can contain error traces, or any field that is needed to add.
Proof of concept
If you just want to jump into the repository with all the code, 👉 check it out here 👈
In order to show the capabilities of tracing with OpenTelemetry a very simplified checkout domain is going to be used. The following is going to use different communication protocols such as HTTP, gRPC and AMQP. The use case is:
There is a checkout-gateway that receives and validates HTTP requests from a frontend when a customer wants to finalize the payment. The frontend will be simulated via a cURL request.
The gateway communicates via gRPC with the checkout-service. This service will do some processing and when it is done it will publish an AMQP message which name is checkout.processed.
The mentioned message is consumed with the stock-service that will adjust the stock quantities.

In order to keep things simple, the gateway validation, the checkout processing and the stock adjustment of quantities is going to be ignored. The only important part here is to generate the trace and to propagate via different transports.
It is also worth mentioning that this is an intended oversimplification and not how a real checkout domain should look.
Some concepts such as gRPC, Dockerfile, docker-compose and AMQP will be shown but not explained fully, if these are new to you, please refer to the documentation before using them in a work environment.
Three microservices and two additional libraries will be used for this example, and to keep things simple they will be under the same repository.
If using VS Code, make sure to enable multiple workspaces so
goplswill not throw an error about having multiple module files (one for each folder). More info here.
Introducing Jaeger
Jaeger is an open tracing tool that let us monitor and troubleshoot distributed transactions. It is also a project from CNCF. For an easy start up, it provides a docker image that contains the UI, collector, query, and agent, with an in memory storage component.
Create a repository and in the root add the docker-compose.yaml. In this file we are going to add all the services, but for now let’s add Jaeger:
version: "3.9"
services:
  jaeger:
    image: "jaegertracing/all-in-one:latest"
    ports:
      - "16686:16686"
      - "4318:4318"
Adding the proto library
The checkout-gateway will communicate with the checkout-service and this is going to happen with gRPC. For this we need to define the proto files for both the client and the server. In the root of the repository create a folder named proto and inside the folder execute:
NOTE: For all the upcoming go module initialization remember to replace the text above with the path to your repository.
go mod init github.com/pmorelli92/open-telemetry-go/proto
In both the gateway and checkout we are going to reference to this library, so that is why each service will have a different ending / to differentiate them.
Now create a checkout.proto file in the folder with the following content:
syntax = "proto3";

option go_package = "github.com/pmorelli92/open-telemetry-go/proto";

package checkout;

service Checkout {
  rpc DoCheckout (CheckoutRequest) returns (CheckoutResponse) {}
}

message CheckoutRequest {
  repeated int32 itemsID = 1;
}

message CheckoutResponse {
  int32 totalAmount = 1;
}
Out of this proto file some golang structures are going to be generated such as a CheckoutClient, CheckoutServer, CheckoutRequest and CheckoutResponse. In the proto folder execute:
NOTE: In order to execute the line below you need to install the proto generator tool: brew install protoc.
protoc --go-grpc_out=. --go_out=. --go-grpc_opt=paths=source_relative --go_opt=paths=source_relative checkout.proto && go mod tidy
After running this command, you should have the files checkout.pb.go and checkout_grpc.pb.go. Commit and push these files so they are available for getting them as dependency.
Adding the utils library
Some of the functions that are going to be used will be repeated throughout all the services. Things such as parsing an environment variable, injecting AMQP headers and getting an AMQP connection. In an enterprise environment one can take decisions as repeating the few lines of coding instead of adding a dependency, or split the dependencies in different libraries.
In order to keep things simple, only one library is going to be used here. In the root of the repository create a folder named utils and inside the folder execute:
go mod init github.com/pmorelli92/open-telemetry-go/utils
Create a file named env.go. This file will contain the EnvString function that will parse an environment variable to fetch the value. If this one is not set, it will fallback to a default value.
package utils

import "syscall"

func EnvString(key, fallback string) string {
	if value, ok := syscall.Getenv(key); ok {
		return value
	}
	return fallback
}
Create another file named tracer.go and add the SetGlobalTracer function shown below. This function will do several things:
- Set up a jaeger exporter: This one has to be aware of the endpoint where the agent is running. This data is supplied by parameter.
- Set up the trace provider: This is set up in a global scope so it is not returned by the function. The trace provider comes from the OpenTelemetry library and uses the exporter that satisfies the interface which OpenTelemetry expects.
func SetGlobalTracer(ctx context.Context, serviceName, exporterEndpoint string) error {
	client := otlptracehttp.NewClient(
		otlptracehttp.WithInsecure(),
		otlptracehttp.WithEndpoint(exporterEndpoint))

	exporter, err := otlptrace.New(ctx, client)
	if err != nil {
		return err
	}

	tp := tracesdk.NewTracerProvider(
		tracesdk.WithBatcher(exporter),
		tracesdk.WithResource(resource.NewWithAttributes(
			semconv.SchemaURL,
			semconv.ServiceNameKey.String(serviceName),
		)),
	)

	otel.SetTracerProvider(tp)
	otel.SetTextMapPropagator(propagation.NewCompositeTextMapPropagator(propagation.TraceContext{}))
	return nil
}
Running a go mod tidy should fetch all the dependencies required. For now this is all needed, commit and push.
The gateway
This component is pretty straightforward. It should expose an HTTP server with the /api/checkout endpoint and communicate with the checkout service via gRPC. It will also set up the global tracer using the function defined above.
In order to do these things some environment variables are going to be used:
- JAEGER_ENDPOINT
- HTTP_ADDRESS
- CHECKOUT_SERVICE_ADDRESS
Create a folder named gateway and inside it, initialize go mod and add the dependency to both the proto and utils package:
go mod init github.com/pmorelli92/open-telemetry-go/gateway
go get github.com/pmorelli92/open-telemetry-go/proto
go get github.com/pmorelli92/open-telemetry-go/utils
Inside the folder create the main.go file:
package main

import (
	"github.com/pmorelli92/open-telemetry-go/utils"
	"log"
)

func main() {
	jaegerEndpoint := utils.EnvString("JAEGER_ENDPOINT", "localhost:4318")
	checkoutAddress := utils.EnvString("CHECKOUT_SERVICE_ADDRESS", "localhost:8080")
	httpAddress := utils.EnvString("HTTP_ADDRESS", ":8081")

	err := utils.SetGlobalTracer(context.Background(), "gateway", jaegerAddress, jaegerPort)
	if err != nil {
		log.Fatalf("failed to create tracer: %v", err)
	}

	// Add GRPC
	// Add HTTP
}
So far, the code is just parsing the environment variables and invoking the SetGlobalTracer supplying the service name and the agent endpoint. Then, replace the // Add GRPC comment with the following content:
conn, err := grpc.Dial(
	checkoutAddress,
	grpc.WithTransportCredentials(insecure.NewCredentials()),
	grpc.WithUnaryInterceptor(otelgrpc.UnaryClientInterceptor()),
	grpc.WithStreamInterceptor(otelgrpc.StreamClientInterceptor()))

if err != nil {
	log.Fatalf("did not connect: %v", err)
}
defer conn.Close()
c := pb.NewCheckoutClient(conn)
There are two unsolved references:
otelgrpcwhich is a library that enables the propagation of a trace via gRPC protocol. This means that when frontend calls the gateway and the trace is created, this library, using thectx, will propagate the trace via gRPC to the checkout service. To reference this library run:
go get go.opentelemetry.io/contrib/instrumentation/google.golang.org/grpc/otelgrpc
- The other unsolved reference is
pbthat prefixes theNewCheckoutClient. As mentioned before, this code is generated on the proto module. Just add on the imports:
pb "github.com/pmorelli92/open-telemetry-go/proto"
Lastly, replace the Add HTTP comment with the following content:
// HTTP config
router := http.NewServeMux()
router.HandleFunc("/api/checkout", checkoutHandler(c))
fmt.Println("HTTP server listening at ", httpAddress)
log.Fatal(http.ListenAndServe(httpAddress, router))
This piece of code is creating a router and starting the HTTP server. It is also defining that for the route /api/checkout it is going to use the checkoutHandler that will take the checkout gRPC client as parameter. The checkout handler looks as follow:
func checkoutHandler(c pb.CheckoutClient) func(http.ResponseWriter, *http.Request) {
	return func(w http.ResponseWriter, r *http.Request) {
		// Allow only POST
		if r.Method != http.MethodPost {
			w.WriteHeader(http.StatusMethodNotAllowed)
			return
		}

		// Create a tracer span
		tr := otel.Tracer("http")
		ctx, span := tr.Start(r.Context(), fmt.Sprintf("%s %s", r.Method, r.RequestURI))
		defer span.End()

		// Make the GRPC call to checkout-service
		_, err := c.DoCheckout(ctx, &pb.CheckoutRequest{
			ItemsID: []int32{1, 2, 3, 4},
		})

		// Check for errors
		rStatus := status.Convert(err)
		if rStatus != nil {
			span.SetStatus(codes.Error, err.Error())
			w.WriteHeader(http.StatusInternalServerError)
			return
		}

		// Success
		w.WriteHeader(http.StatusAccepted)
	}
}
The only thing that may look unfamiliar here is the creation of a trace. As mentioned before, the trace is the distributed transaction. It will be created wherever the user journey starts and be propagated until the user journey ends. In order to create a trace one needs a Tracer that will be provided by the global tracing provider that the utils.SetGlobalTracer set for us.
Generating a trace with result in two things, the distributed transaction being created and a first child called Span. Each span represents an operation and a trace an have N of them. A span will have a start and close time (and hence a duration).
After the call to the gRPC server is done, if it returned an error then span.SetStatus(codes.Error, err.Error()) is invoked. This means that the span will be aware of the operation failing. Some information of the error is also stored for easiness to troubleshoot what happened.
Code is then finished, now add a Dockerfile:
FROM golang:alpine3.18 AS compiler
RUN apk --update --no-cache add git
WORKDIR /gateway

ADD go.mod go.sum ./
RUN go mod download

ADD . .
RUN CGO_ENABLED=0 go build -o /bin/goapp ./main.go

FROM scratch
COPY --from=compiler /bin/goapp /gateway
ENTRYPOINT ["/gateway"]
Back on the root of the repository, add the service to the docker-compose.yaml:
version: "3.9"
services:
  jaeger:
    image: "jaegertracing/all-in-one:latest"
    ports:
      - "16686:16686"
      - "4318:4318"
  gateway:
    build:
      context: gateway
    restart: on-failure
    ports:
      - "8081:8081"
    environment:
      - JAEGER_ENDPOINT=jaeger:4318
      - CHECKOUT_SERVICE_ADDRESS=checkout:8080
      - HTTP_ADDRESS=:8081
    depends_on:
      - jaeger
	  - checkout
Execute go mod tidy and you are ready for a commit and push.
Trying things out
You should be able to start up both jaeger and the gateway executing from the root of the repository: docker-compose up --build. After the services are up and running you can try calling the gateway with cURL:
curl -v -X POST http://localhost:8081/api/checkout

< HTTP/1.1 500 Internal Server Error
< Date: Fri, 03 Dec 2021 17:43:49 GMT
< Content-Length: 0
The response is 500 due to the checkout service not being up yet. But the trace should have been created, and with then two spans: one created with the trace and one with the gRPC client.
Go to http://localhost:16686, on the UI select the service gateway and click Find Traces. You should be able to see a trace, click on it to see more details:
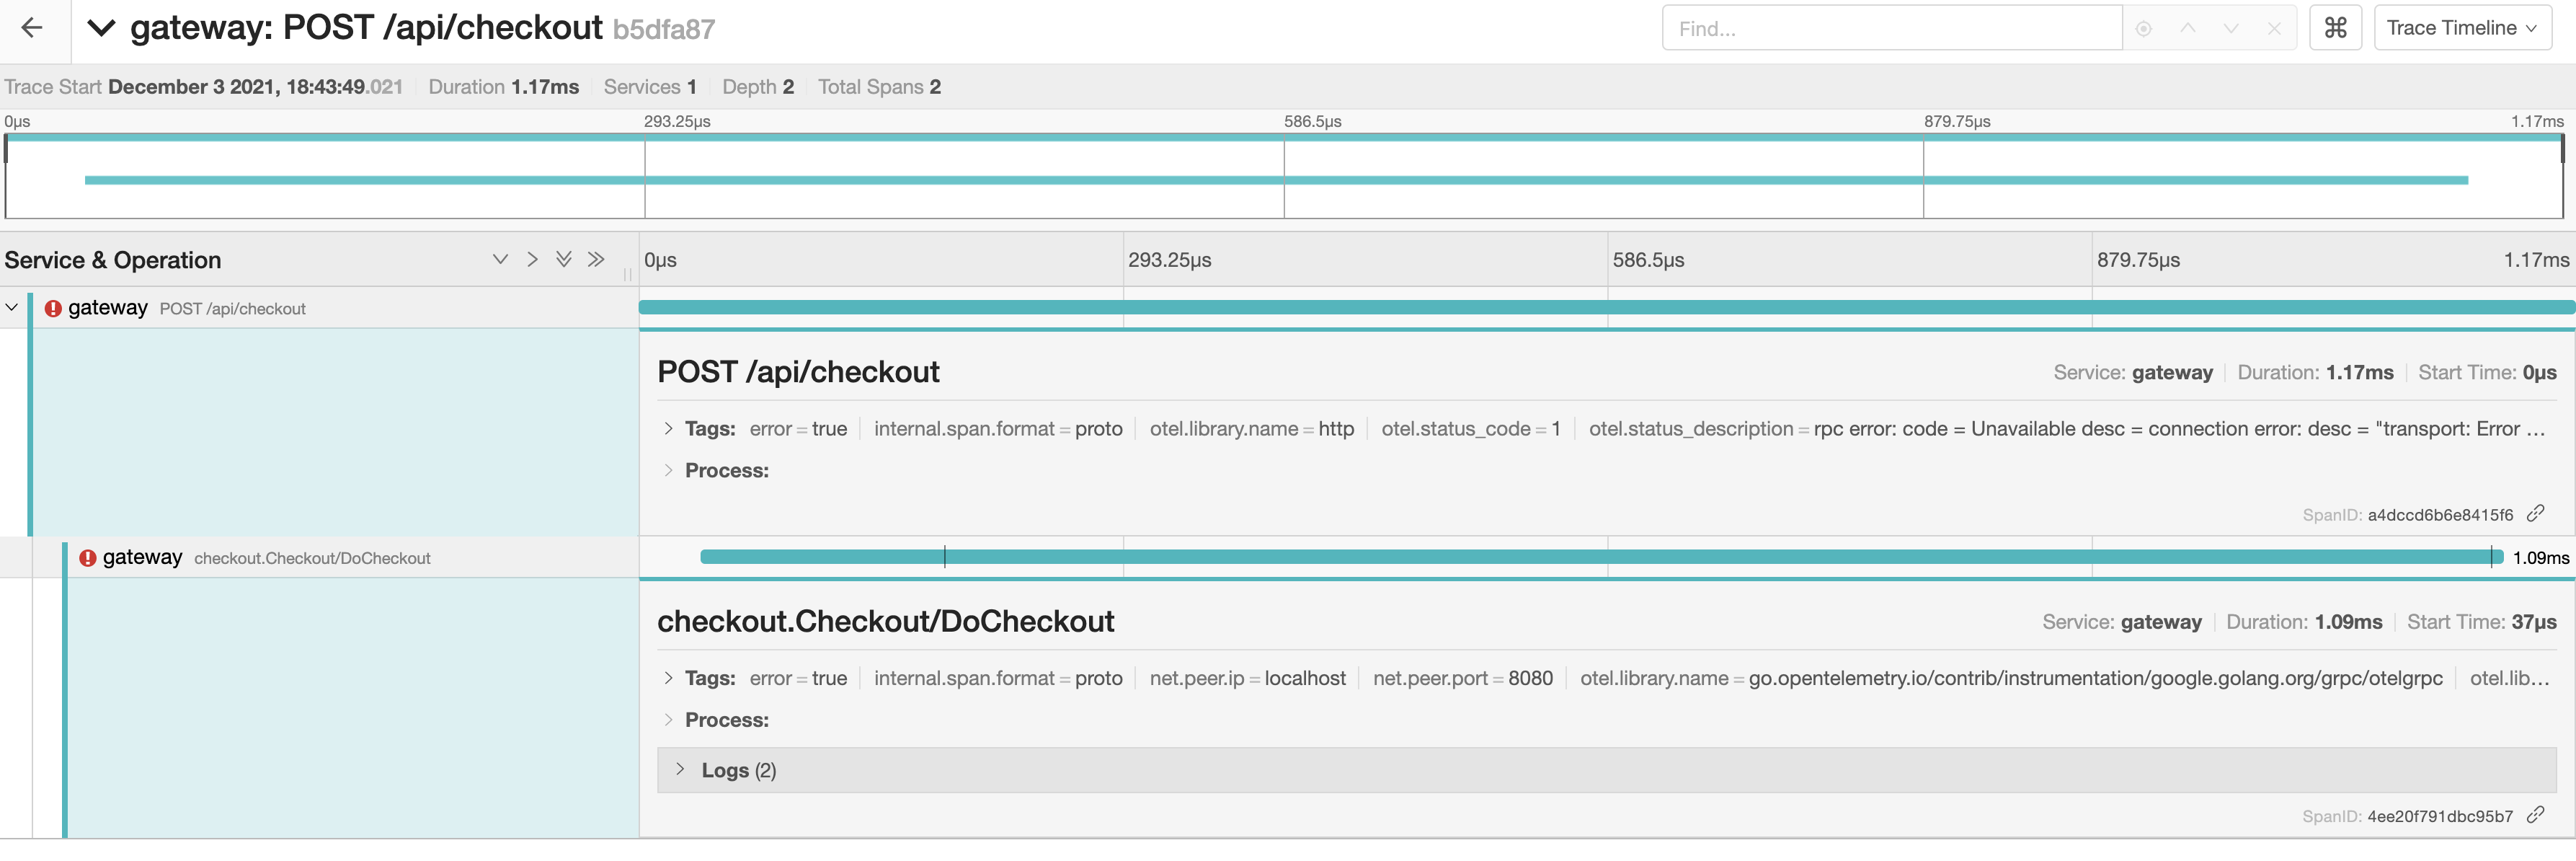
As mentioned before, the trace has two spans. Both of the spans are decorated with a red exclamation mark indicating the operation failed. The first one has it as it was added with the span.SetStatus function on the checkoutHandler. The second span has it as the gRPC call failed.
We can see that the trace has two spans. The first one is created manually on the checkoutHandler and the status is error due to the span.SetStatus function. The other span is created by the otel library and also contains an error.
You can try out to add more data to a span invoking span.AddEvent.
Summary
In this first article we have done quite a lot from discussing what the problematic is, what tools do we have to solve it, and even implementing a service that uses tracing. In the second part we will implement the checkout-service and the stock-service and explore Jaeger a bit more. Stay tuned!